
Given the volatility in the market around various cryptocurrency prices, we wanted to try out simple neural network on freely available data to see if we can predict crypto prices with reasonable accuracy and without requiring drastic computing resources. Data for this exercise was gathered from CoinMarketCap. We used time-series data for cryptocurrencies such as Bitcoin, Litecoin, Ethereum, Bitcoin-cash and Ripple.
THE DATA
For each currency, the data is from the day when it was launched or when it started generating some market value. For example for Bitcoin(BTC) the data is from April 28, 2013 to present day. For Ethereum(ETH), it is from August 07,2015 to present day.
The data contains total of 6 main features. The details for them are as follows :
- Close Price – It is the market close price for currency for that particular day.
- Open Price – It is market open price for currency for that day.
- High Price – It is highest price of currency for the day.
- Low Price – It is the lowest price for currency for that day.
- Volume – The volume of currency that is being in trade for that day.
- Market Cap – The total market cap value of currency for that day. It can vary a lot on given day depending upon volatility in prices.
CORRELATION BETWEEN CURRENCIES
To start with, let’s take a look at the relationship between some of these cryptocurrencies using the data we have. Below is correlation chart for close prices –

Bitcoin and Ethereum shows correlation around 92%, while Bitcoin and Ripple shows less than 75%. Bitcoin to Bitcoin-cash shows around 88% correlation while Bitcoin and Litecoin shows even more than that around 95%. Similar conclusions can be made for other currencies as well by looking at the above correlation plot.
You can use our Github repository source code as reference to plot the above chart.
PREDICTING “CLOSE PRICES” USING LSTM NEURAL NETWORK
Overall, below are the steps we followed to predict “close prices” using LSTM neural network.
- Building LSTM model using Keras
- Normalizing data using MinMaxScaler from Scikit-Learn.
- Re-framing of data for supervised learning using Pandas
- Training LSTM model on training data set
- Testing/Predicting close prices
Given that we are dealing with time series data, LSTM is well suited. Long short-term memory (LSTM) units (or blocks) are a building unit for layers of a recurrent neural network (RNN). An RNN composed of LSTM units is often called an LSTM network.
The expression long short-term refers to the fact that LSTM is a model for the short-term memory which can last for a long period of time. An LSTM is well-suited to classify, process and predict time series given time lags of unknown size and duration between important events. LSTMs were developed to deal with the exploding and vanishing gradient problem when training traditional RNNs. Relative insensitivity to gap length gives an advantage to LSTM over alternative RNNs, hidden Markov models and other sequence learning methods in numerous applications.
The paper titled “Applying LSTM to Time Series Predictable through Time-Window Approaches” (get the PDF), Gers, Eck and Schmidhuber, published in 2001, shows the promising results of LSTM on time series data. In the paper authors have shown LSTM addressing two difficult time-series problems. First one is Mackey-Glass Series and the second is Chaotic Laser Data (Set A). Both the data sets are regarded as benchmark on time-series analysis. For more details regarding it please visit this blog post .
In our model we are building simple LSTM in Keras(see official site of keras for more information). Keras is high level API wrapper, deep learning framework which runs on the top of Tensorflow or Caffe2. It leverages GPU capabilities as well. So for simple models it is really good choice.
Our model architecture is simple. It contains 75 to 80 neurons in network. We are using Adam optimizer for optimization of loss function, which will be mean absolute error. It is also common to use RMSE(Root mean square error), but we will go with classic one.
Below code snippet is to build LSTM model using Keras.

As we have data and our model, let’s prepare our data for training our LSTM model. The data that we have with various values ranging from some 10,000 USD to up to 216740000000 USD for Market Cap. This is not good for any model to learn. So we will normalize our data using MinMaxScaler using Scikit-Learn.

The above code normalizes the data for the Bitcoin to zero mean and standard deviation of one.
As the data is time-series, we have to prepare the data in such a way that for the present day data we can predict next day close price as output. For creating the data we are using function as shown below
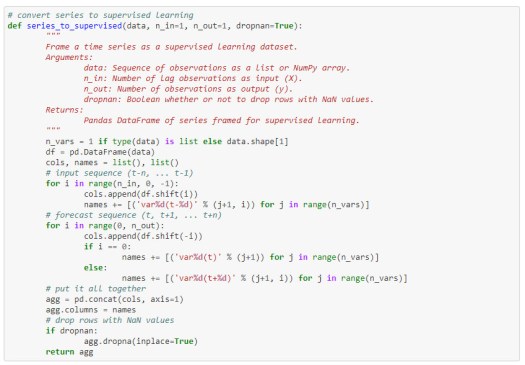
Applying above function to our Bitcoin data will give us a newly re-framed data and the first five output of re-framed data can be seen below in normalized form.

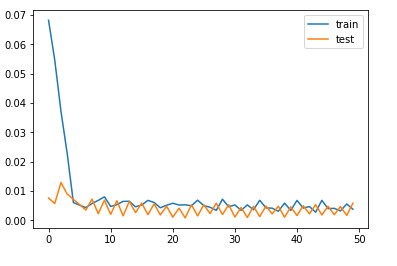
Now we got our model, prepared data as well. It is time to train the model and see how it performs on test set. We will train LSTM model in batch size of 32 for 50 epochs(number of training iterations). And then we will plot the loss with respect to epochs for train and test set. For Bitcoin the plot looks like this,
For testing our model, we will use following block of code

PREDICTION RESULTS:
Bitcoin
Now let’s make some prediction and see how it is really performing. We are predicting Bitcoin close prices from 22 January to 27 January, 2018 and comparing with real close prices on those days.

The above data shows that our prediction model has performed reasonably well with predicted close prices and real close prices differ from 0 to 5.1%. The highest difference is around $ 586 while the percentage diff is around 5.1% compare to real close price.
Ethereum
For Ethereum also, we are predicting for 21 January to 27 January 2018 to test how we are doing on unseen data. So below table is what we are getting for Ethereum.

As shown above, difference between real and predicted close price is 0% to 7.4%. For really simple LSTM model we’ve trained and tested.
Ripple
We have trained same LSTM model on Ripple data. We are predicting prices from 22 January to 27 January, 2018. Below table shows our output.

Again, overall difference between real and predicted prices is from 0 to 5.6%.
CONCLUSION
In this brief demonstration, we can predict prices of cryptocurrencies using time series data by using deep learning. We have used simple LSTM network. Bidirectional LSTM network can also be used, training model could be done for longer time period and can be fine tuned for better accuracy. Similar approach can be applied to other financial time series data to predict results.
Our source code repository is available here to try out LSTM model we built.